
Amal John | Météo-France, Toulouse, France


___________________________________________________________________________________________
Extreme weather events, particularly heavy precipitation, have been documented throughout human history. It’s always been there, and it’s had an equal impact on human and natural life on the planet. However, we always find a way to deal with it, whether it’s through it or over it. In comparison to previous years, the strength and number of heavy precipitation events have increased in recent years. Decades of studies have shown that global warming has the potential to affect the average water cycle. The scientific community has repeatedly established that extreme precipitation has increased in strength and numbers in recent years and will continue to do so in the foreseeable future.
Climate models are a mathematical representation of our climate system, made up of various energy and water cycles, and are now widely utilized as a tool to obtain a comprehensive picture of the climate system’s past, present, and future. There are several modelling communities all around the world that participate in simulating the climate system and attempting to give us a credible future scenario. It’s important to remember that each model is a unique dynamic system, and the projections it generates will differ from one model to another. Some models may estimate an increase in extremes in a specific location, while others may not. So, as climate scientists, we usually take the average of all available simulations and project a likely future. But the main question that we tend to overlook is how confident we are in these projections. There have been few to no articles that address the issue of uncertainty in our future heavy precipitation projections. This is the first research to dig into this topic and present an overarching picture of the uncertainty we might expect from future heavy precipitation projections using CMIP6 models.
The study made use of 35 CMIP6 global climate models. We used the end-of-the-road scenario, also known as SSP5-8.5. This scenario is adopted because it allows us to investigate the worst-case scenario that we can expect in the future with high emissions and low mitigation. According to our findings, the expected severity of extremes in the future has a considerable spread or uncertainty. Apart from the considerable uncertainty, we discovered that roughly 90% of the models predict an increase in heavy precipitation, which robustly agrees with the results of the previous generation of models.
This research also tries to explain why our simulations have such a wide range of results. The total uncertainty that we quantified in our research is the result of the addition of two distinct uncertainties. The first is model uncertainty, which stems from our inability to replicate and represent the various important physical processes that occur in the natural climate system accurately. The second kind of uncertainty is uncertainty due to a lack of sampling, which we might refer to as uncertainty due to internal variability. With improved mechanisms and high sample sizes, both can be reduced to a minimum, which we advise the modelling community to work on for the next generation of CMIP models.
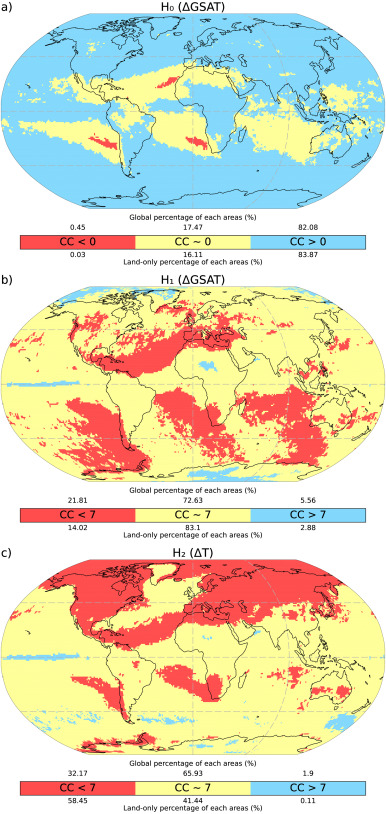
Any discussion of extreme precipitation change would be incomplete unless the popular Clausius-Clapeyron (CC) relationship is mentioned. According to the CC relationship, every degree of increase in the Earth’s surface temperature results in a 7% increase in the water holding capacity of the atmosphere, which translates to a 6-7% increase in extreme precipitation. A global map depicting the regions that are consistent with the CC rate of 7%/K is another fascinating and crucial conclusion presented in the research. We call this map the CC blueprint because it can essentially be used as a guide to characterizing which regions follow the CC rate of increase, and which do not. The CC blueprint will serve as a useful map for future research, and it may even stimulate climate scientists to dig deeper into a thorough investigation of specific locations of interest.
This study, we believe, contributes to our confidence in the intensification of extreme precipitation. The rate of change in extreme precipitation displayed here only depicts a possible possibility due to the uncertainty. This suggests that we won’t be able to make a more accurate projection unless both model uncertainty and internal variability are reduced. This blog post’s sole objective is to provide insight into our most recent published research, and it is designed as a text for science communication rather than a qualitative study.
Please see https://doi.org/10.1016/j.wace.2022.100435 for more scientific viewpoints and analyses.