
Mónica Minjares | Centre de Recerca Matemàtica
Álvaro Corral | Centre de Recerca Matemàtica
INTRODUCTION
As Randall [1] explains, in recent years atmospheric science has been “struggling to understand a very large and powerful tropical weather system called the Madden-Julian oscillation, or MJO. The MJO occurs mainly over the remote tropical oceans and was not discovered until the early 1970s. It strongly influences precipitation over southern Asia and northern Australia, affecting the lives of literally billions of people. It is also believed to influence the timing and intensity of El Niños. Despite its importance, the MJO is perhaps the last type of weather system for which the basic physical mechanisms are not well understood.” Following Hottovy [2], 10 years after Randall, one can state that nowadays “there is a lot of hypotheses about basic physical mechanisms of the MJO but not a consensus on them.”
The MJO constitutes the principal mode of variability in the tropical weather on sub-seasonal time scales (this goes from two weeks to approximately three months) and not only has a strong influence in the tropics but it also affects higher latitudes through teleconnection patterns [3]. The MJO is an atmospheric structure that, when it is active, tends to move eastward with an average speed of about 5 m/s. It is characterized by a region of strong convection with precipitation and upward motion, and ahead (to the east) and behind (to the west) there are regions of suppressed convection with dry conditions.
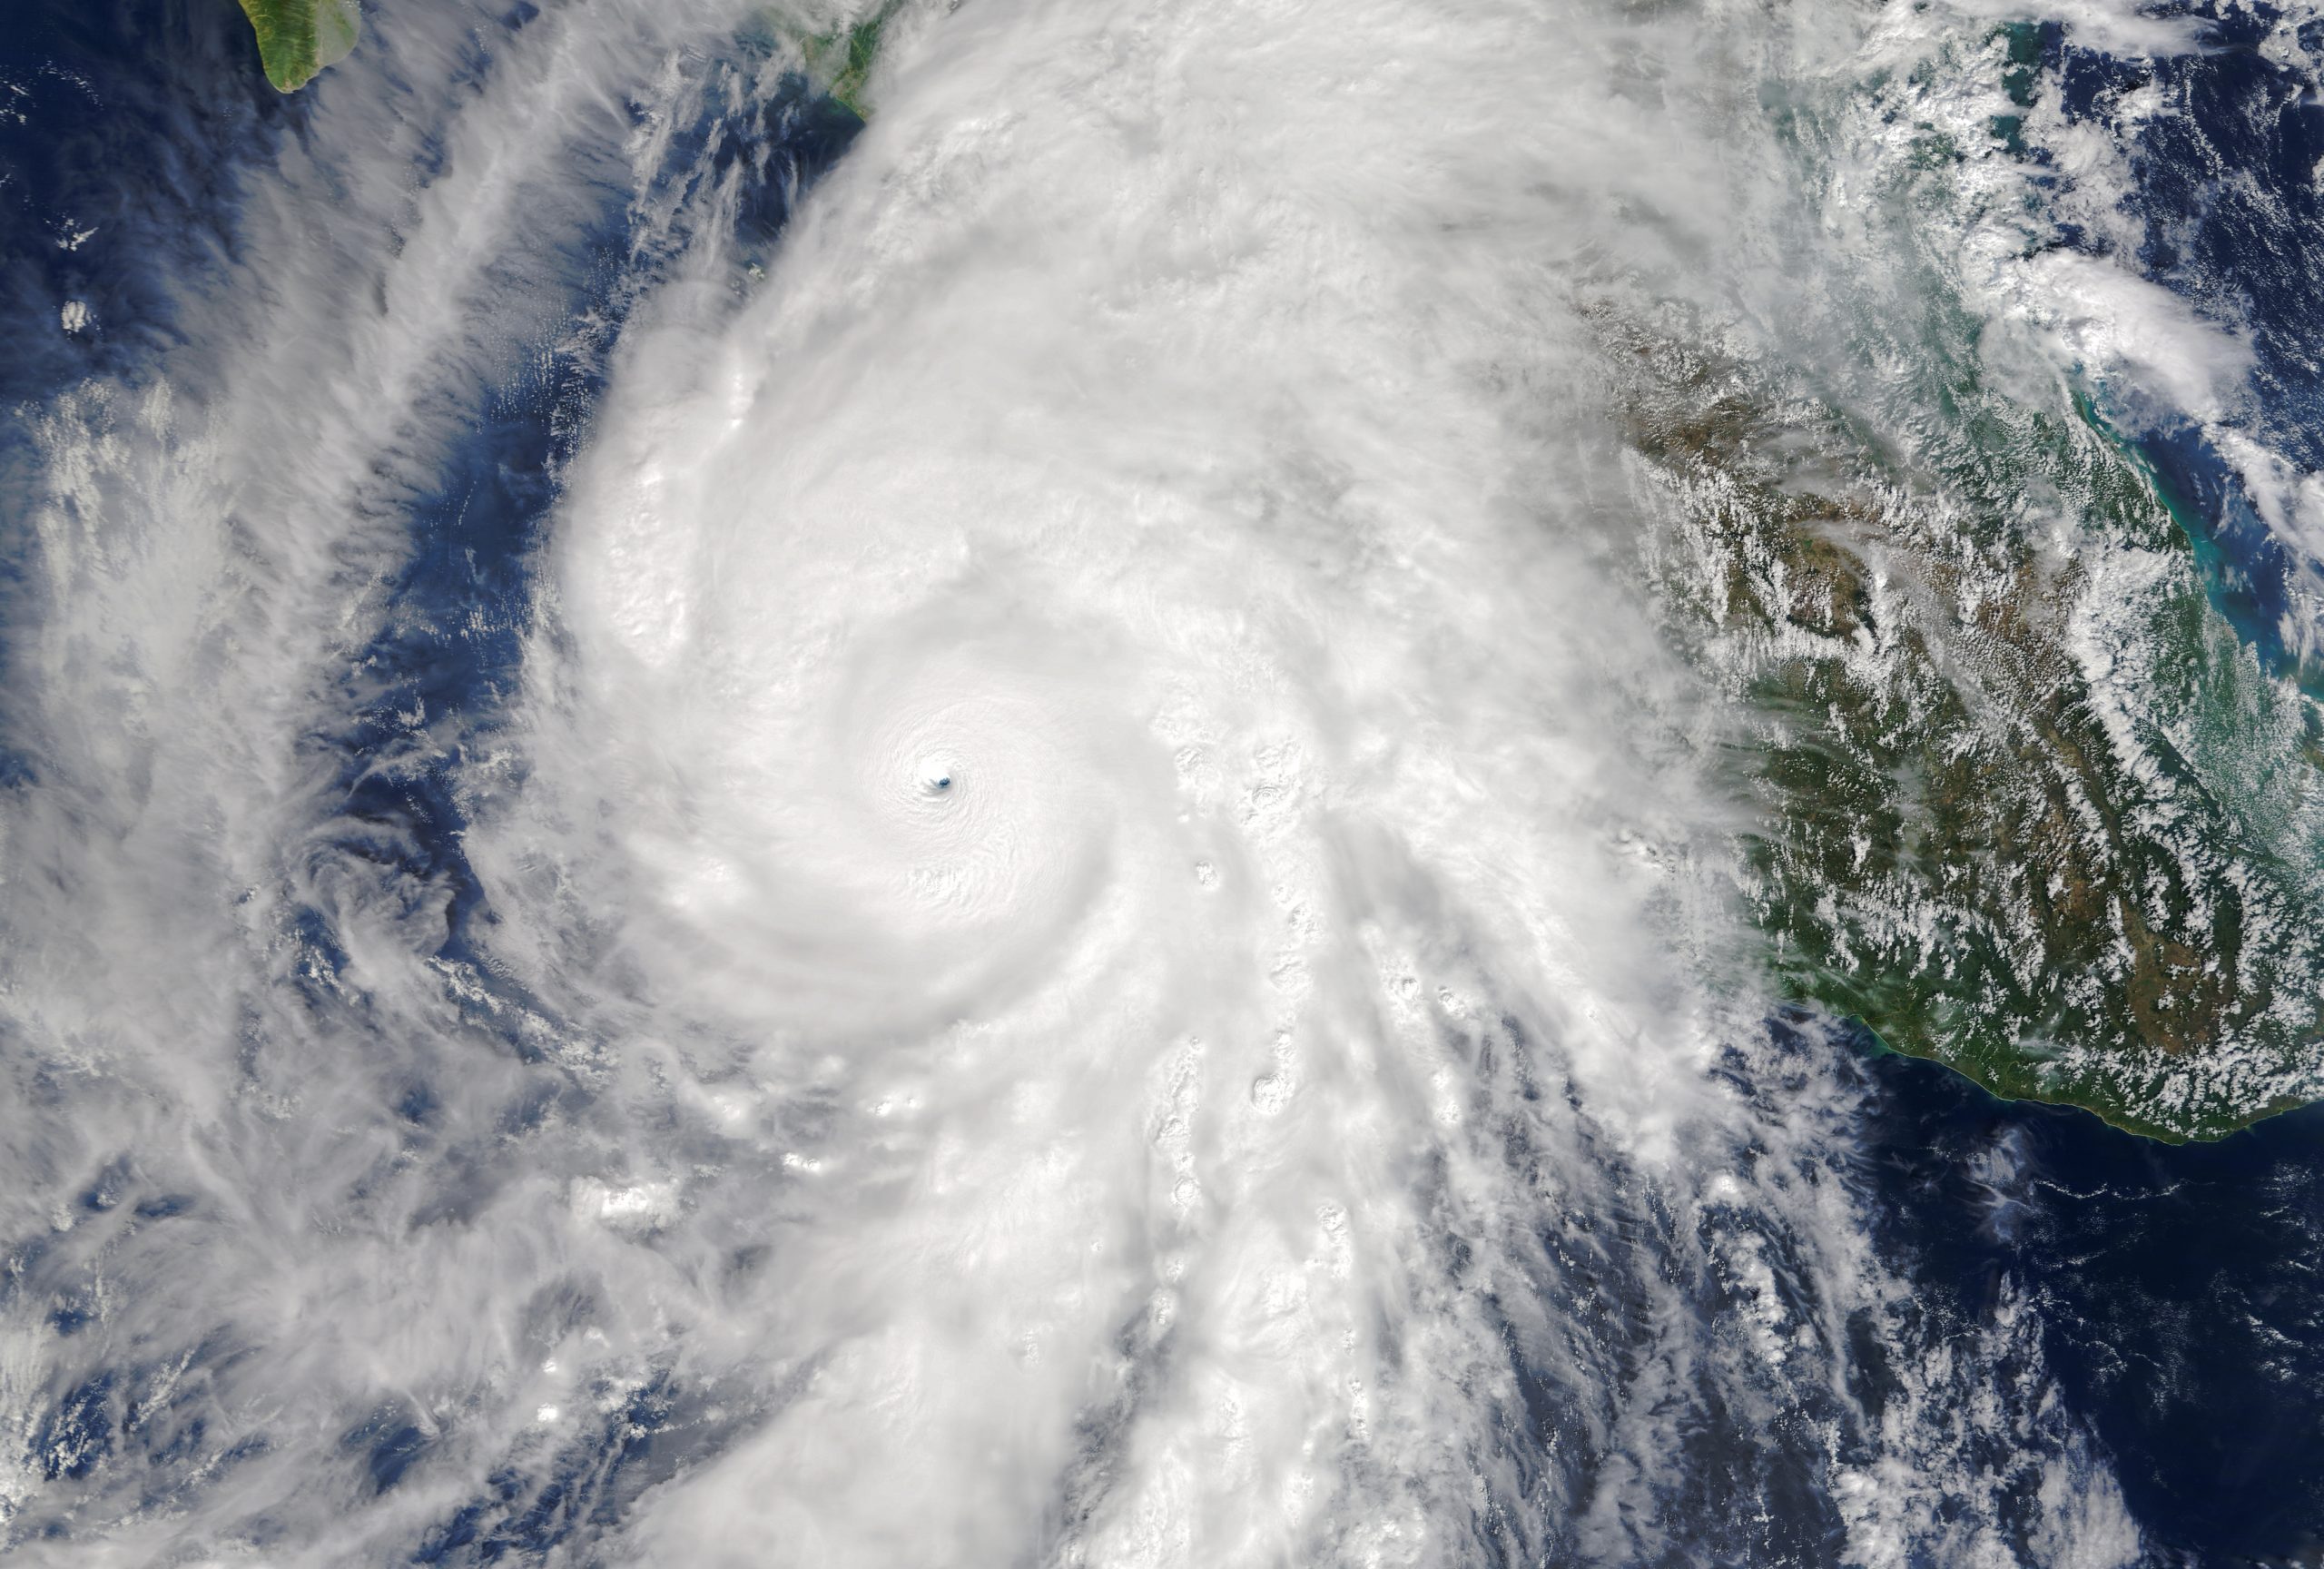
Previous studies have found that many atmospheric processes are characterized by so-called power-law distributions. Take the example of tropical cyclones (roughly speaking, hurricanes and typhoons, but also tropical storms and tropical depressions). Tropical cyclones are routinely identified as individual spatiotemporal events, for which the maximum sustained wind speed is recorded every 6 hours, from onset to dissipation. This speed allows one to understand tropical cyclones as an excitation or activation process. Integration of the cube of this speed along the lifetime of the tropical cyclone yields a proxy of the total energy dissipated by the tropical cyclone. It has been found that the tropical-cyclone energy estimated in this way follows a power-law distribution, with nearly the same exponent for all tropical-cyclone basins [4].
In mathematical terms: if x denotes the energy of a tropical cyclone, a power-law (pl) distribution is characterized by the probability density
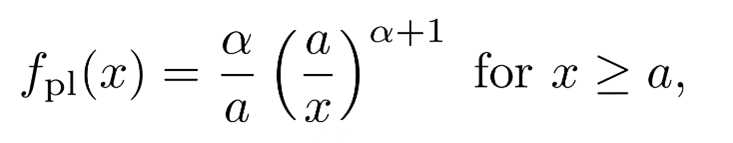
where α + 1 is the power-law exponent and a is the lower cut-off, which means that data below a is disregarded and the power law only describes the tail of the distribution (values of x above a). Notice that this distribution is very different from the well-known normal distribution (Gauss bell curve), not only in that it is highly asymmetric (or skewed, in technical jargon) but also in a more fundamental way: the moments of the distribution (for instance, the mean) may be infinite (for instance, if α ≤ 1).
In the concrete case of tropical cyclones this power-law property is broken beyond a value x = b, and one has instead a truncated power-law (tpl) distribution, given by the following probability density
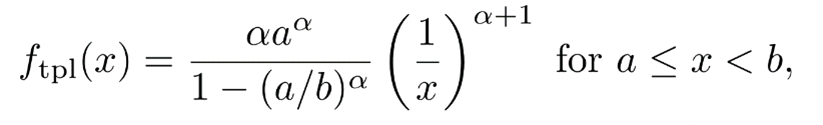
where the new parameter with respect to the untruncated power law is the upper cut-off b. The fact that b is not infinite makes that the moments of this distribution are not infinite either. But take into account that this distribution only describes a part of the data, that in the range from a to b. In the case of tropical cyclones, deviations from the power-law behavior for energies above b were associated [4] with the effect of the physical boundaries of the ocean basins where tropical cyclones “live”.
The presence of this and other power-law distributions (such as in single-site rain measurements and spatio-temporal rain clusters) in meteorology (difficult to explain from the chaotic-atmosphere paradigm) could be an indication that the weather-climate system is close to a “critical state” (as it has been claimed in the case of other Earth systems generating natural hazards). Indeed, Peters and Neelin [5] found evidence of the existence of a sudden but continuous transition between a non-rainy and a rainy phase as a function of the water-vapor content of the atmosphere, analogous to a thermodynamic second-order phase transition. In addition, the state of the atmosphere would show a tendency to be located at the onset of this transition, i.e., at the critical point, which would explain the prevalence of power laws in atmospheric processes, as power laws are one of the hallmarks of critical phenomena.
The spontaneous criticality of the atmosphere may be originated from a feedback mechanism that triggers the existence of an attractor at the onset of the transition; this phenomenon is referred to as self-organized criticality. In simple terms, when the atmosphere is in the subcritical phase (low water-vapor content and no rain) the mechanisms at work increase the water-vapor content, until the critical point is reached, and the chance of rain increases; this hinders the further increase of the water-vapor content. On the other hand, if the system enters into the supercritical phase (high water-vapor content) the dynamics is rainy, which decreases the water-vapor content, until the non-rainy (subcritical) phase is reached. In this way, the system fluctuates around the critical point of the transition.
One key characteristic of criticality is that perturbations evolve keeping a delicate balance between amplification and decay, which has obvious implications for predictability. The coexistence and compatibility of this hypothetical criticality of the atmosphere with its chaotic dynamics remains a fundamental open question.
One important purpose of our research has been to investigate up to what point the MJO shares some of the characteristics of critical systems (such as tropical cyclones), Remarkably, both tropical cyclones and the MJO are governed by convective dynamics.
PROCEDURE
To practically monitor the MJO, Wheeler and Hendon [6] developed a Real-time Multivariate MJO (RMM) index, which consists of the first and second principal components (RMM1 and RMM2) obtained from the empirical orthogonal functions (EOF) that combine latitudinal averages of outgoing longwave radiation (OLR), and zonal winds at lower (850 hPa) and higher (200 hPa) atmospheric levels. The EOFs are calculated for daily fields on a latitudinal band of around the Equator. Notice that, in contrast to other “activation” phenomena, the RMM index characterizes the MJO through a bivariate signal, which introduces an extra degree of complication in comparison with univariate signals, but in this blog post we will mainly ignore the phase.
The data used in our research has been the daily values of the RMM index from the Australian Government Bureau of Meteorology, from January 1979 to December 2021.
The two components of the RMM index can be understood as a vector, and thus, the index can be represented in polar coordinates by its amplitude and phase. The amplitude A is just the modulus of the vector defined by RMM1 and RMM2 in Cartesian coordinates, i.e.,
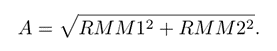
When the amplitude is above a specific threshold equal to one the MJO is active (or activated) and the vector usually moves counterclockwise. If the index is below the threshold, then the MJO activity is considered suppressed or inactive, and the path of the vector is more erratic.
In the most simple definition, based on the RMM index, a Madden-Julian (MJ) event starts when the amplitude A of the index crosses the threshold Ac from below (from A < Ac to A > Ac), and ends when the amplitude crosses the threshold from above (from A > Ac to A < Ac), with the threshold fixed to Ac = 1 (this prescription to fix the threshold is standard although somewhat arbitrary). Thus, the event consists of all the consecutive days in which the amplitude is above (or at) the threshold, signaling a continuously active MJO.
The number of consecutive days with amplitude A > Ac gives the duration d of the MJ event, computed as d = tf – ti +1 (in days), where ti is the starting time of the event (first day above threshold), and tf is related to the ending time (last day above threshold). The size s of the event (or, roughly speaking, the “energy”) is defined as the sum of the amplitudes along the duration of the event, i.e.,
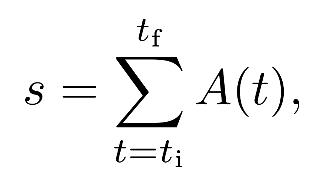
with t denoting time (in days). This is essentially the same definition used for the energy of hurricanes.
RESULTS
Using the available values of the RMM index we computed a series of occurrences of MJ events, as well as their sizes, from which we estimated the corresponding probability density. That of the size, f(s), appears in the figure (in double logarithmic scale, changing the generic letter x by s), showing its broadness, ranging from s = 1 to almost 300 units. The counterpart for event durations, f(d), turns out to be qualitatively similar, ranging from 1 day to more than 150 days. There seems to be a change of behavior (in concrete, a rather sudden change of slope) around s = 47 units and d = 27 days, as we will quantify below.
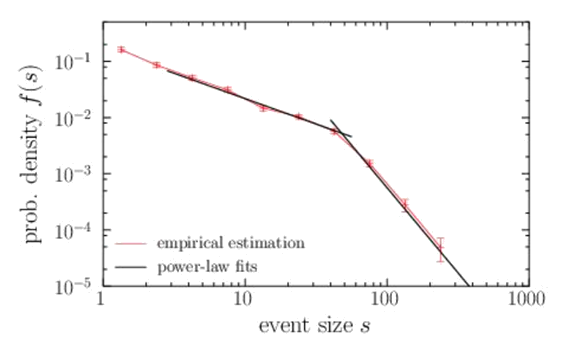
We realized that (in contrast to tropical cyclones) we could fit two power-law distributions to the empirical data (visible in the figure, as power laws are characterized by straight lines in log-log representation). Thus, we obtained one truncated power for intermediate values of the size (the body of the distribution) and another power law for the largest values (the tail of the distribution). As both power laws overlap, one can describe MJ event sizes by the double power-law (dpl) distribution:
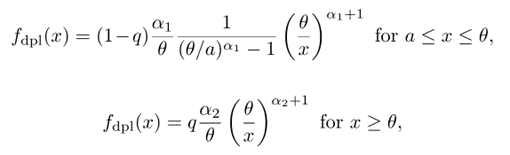
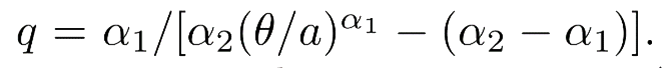
and zero otherwise. The scale parameter θ fulfills θ > a (and marks the sudden change of slope in log-log). Note that now there are two exponents, 1 + α1 and 1 + α2, moreover, a is the lower cut-off and q is not a free parameter but ensures continuity between the two power-law regimes by requiring
The results of the double power-law fit for the distribution of the sizes of MJ events were a = 3, 1 + α1 = 0.93, 1 + α2 =3.0, and θ = 47. If instead of working with event sizes we work with event durations, we obtain similar results, but the change of exponents (the transition from one power law to the other) takes place at around 27 days. This is not unexpected, as sizes and durations are highly (non-linearly) correlated, and 47 in size corresponds to 27 days in duration.
The interpretation of this results is clear. After about 27 days, the MJO (if it still active) shows a sudden increase in extinction probability (i.e., a sudden decrease in survival probability). We verified that this crossover value of 27 days (or 47 units in size) does not seem to depend neither on the initial phase nor on the final phase. And as phases are associated with the geographical position of the convective center, the increase in the extinction probability seems to be independent on the position. This seems to indicate that the extinction is intrinsic (associated to internal dynamics), rather extrinsic (associated to physical spatial barriers).
Further research is necessary to clarify these and other related issues.
BIBLIOGRAPHY
[1] D. Randall. Atmosphere. Clouds, and Climate. Princeton Univ. Press, Princeton, New Jersey, 2012.
[2] S. Hottovy. Unified spectrum of tropical rainfall and waves in a simple stochastic model. CAFE Final Conference, Barcelona, 2022.
[3] E. Hand. The storm king. Science, 350(6256):22-25, 2015.
[4] A. Corral, A. Ossó, and J. E. Llebot. Scaling of tropical-cyclone dissipation. Nature Phys., 6:693-696, 2010.
[5] O. Peters and J. D. Neelin. Critical phenomena in atmospheric precipitation. Nature Phys., 2:393-396, 2006.
[6] M. C. Wheeler and H. H. Hendon. An all-season real-time multivariate MJO index: Development of an index for monitoring and prediction. Monthly weather review, 132(8):1917-1932, 2004.